
Sample 13 rabbit fox
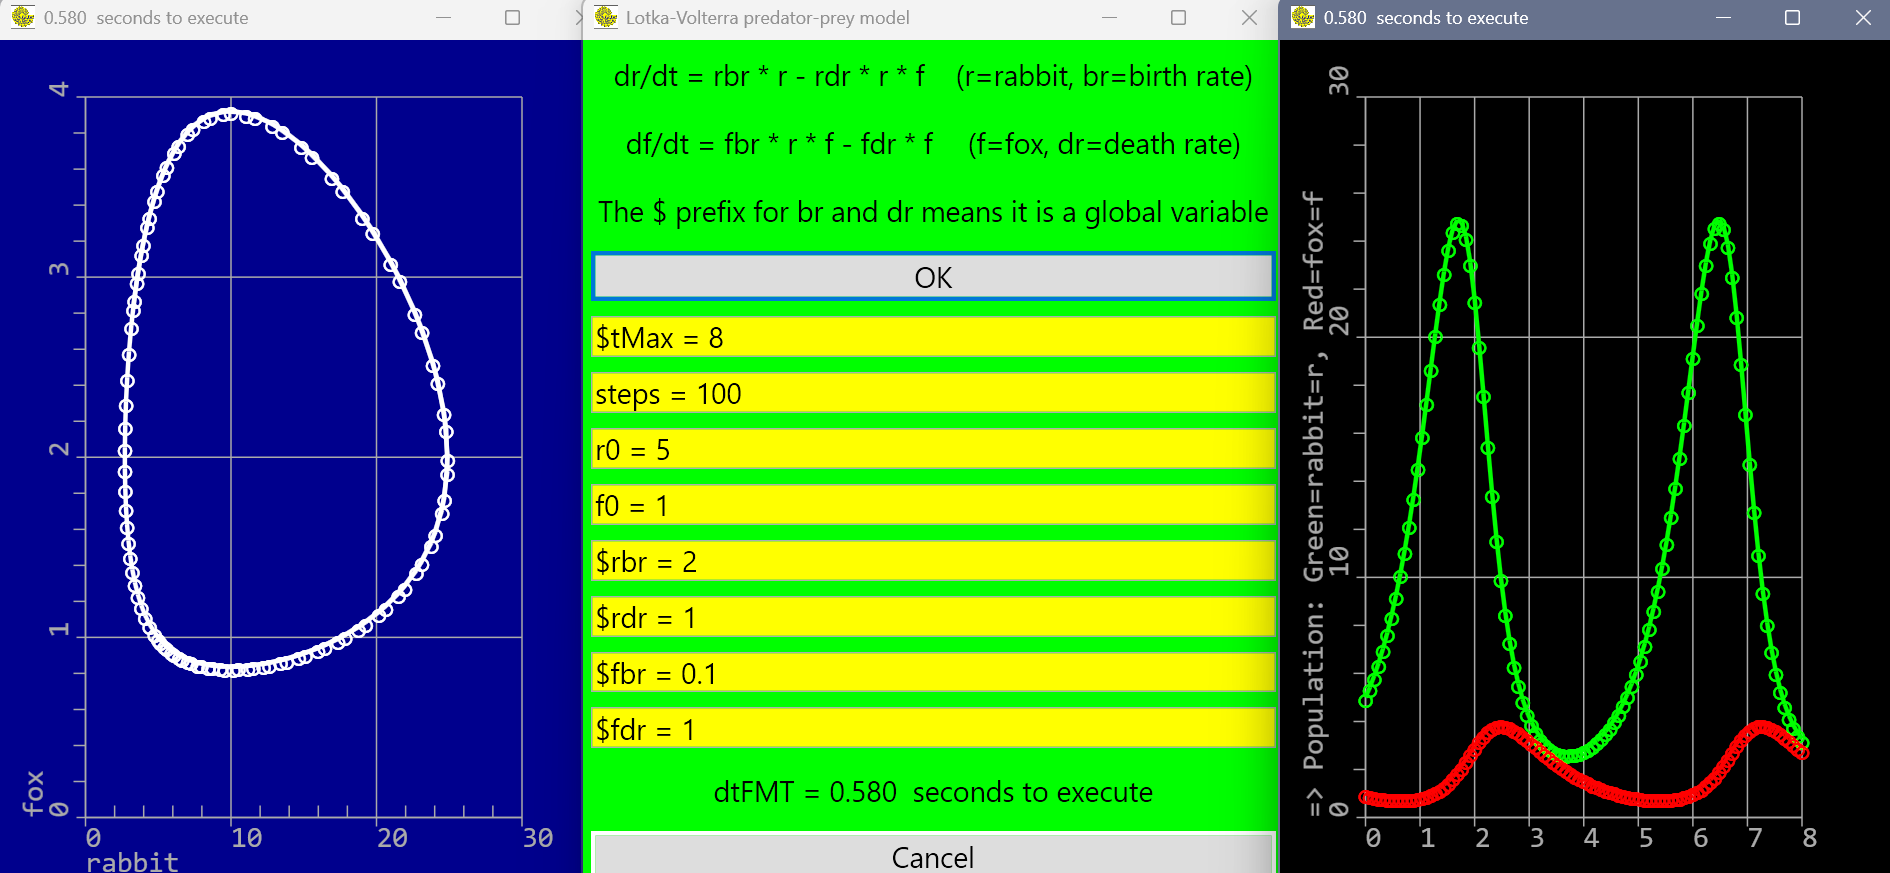
SYSTEM(BackGround=99, RUN=1)
DLG(TItle='rabbit fox', E='#Describe', B='OK')
SET(t=0, steps=100, dtFMT=" ")
$modelR = "dr/dt = rbr * r - rdr * r * f	(r=rabbit, br=birth rate)"
$modelF = "df/dt = fbr * r * f - fdr * f	(f=fox, dr=death rate)"
SET(r0=5, f0=1, $tMin=0, $tMax=8, $yMin=0, $yMax=30, $rbr=2, $rdr=1, $fdr=1, $fbr=0.1)

DO
    SET(y=(2,1), dy=(2,1), $result=(1,3))
    TIME(SECondssince = t0)
    y0 = (r0, f0)
    ODE(y0, $tMin, $tMax, steps, "f2(t, y, dy, $result)")
    dTime = TIME(SECondssince=t0)
    dtFmt = FMT(dTime, "F3") && "seconds to execute"
    Graphics(dtFmt)
    DLG(TI="Lotka-Volterra predator-prey model", BG=90, LBL=$modelR, LBL=$modelF,
        LBL='The $ prefix for br and dr means it is a global variable', B='OK',
        NE=$tMax,SYM, NE=steps,SYM, NE=r0,SYM, NE=f0,SYM, NE=$rbr,SYM, NE=$rdr,SYM,
        NE=$fbr,SYM, NE=$fdr,SYM, LBL=dtFMT,SYM, B='Cancel')
    ARRAY(Name=$result, CLeaR=1)
ENDDO
END

FUNCTION f2(t, y, dy, $result)
    dy(1) =  ($rbr - $rdr * y(2)) * y(1)
    dy(2) =  ($fbr * y(1) - $fdr) * y(2)
END

FUNCTION Graphics(dt)
    SEt(yMin=0, yMax=0, maxPrey=0, maxPred=0)
    DO i = 1, INT(LEN($result))
        yMin = MIN(ymin, $result(i,2), $result(i,3))
        IF(yMin < 0)
            MSG(T='Negative population:||increase steps,|and/or|decrease tmax||for this problem', B="OK")
            EXIT
        ENDIF
        maxPrey = MAX(maxPrey, $result(i,2))
        maxPred = MAX(maxPred, $result(i,3))
    ENDDO
    IF(yMin >= 0)
        yMax = MAX(maxPrey, maxPred)
        DLG(BG=0, L=2/3,T=0, H=1,W=1/3, TI=dt, AX=3, MIN=$tMin, MAX=$tMax, FG=666, Y=1, TI='=> Population: Green=rabbit=r, Red=fox=f', Max=yMax)
        LINE(A=3, C=1, Z=0, XVEC=$result,
            C=2, YVEC=$result,  Width=3, S='○', Draw=90,
            C=3, YVEC=$result, Draw=900)
        DLG(BG=5, L=0,H=1,W=1/3, TI=dt, AX=1, TI='rabbit', MAX=maxPrey, FG=666, Y=1, TI='fox', Max=maxPred)
        LINE(A=1, C=2, Z=0, XVEC=$result, C=3, YVEC=$result,  Width=3, S='○', Draw=999)
    ENDIF
END